Pastila de Joi: [EN] Journey Maps x Analytics
This week’s bit of sharing was inspired by a recent Product Tank meetup in London and revolves around this big question: How can we understand better how a customer interacts with our product, service or brand?
In the past few years, businesses started to understand better the inter-connectedness of the cross-channel experience for the customers and the increasing value of having a good view of all the customer-brand touchpoints, across time and different mediums.
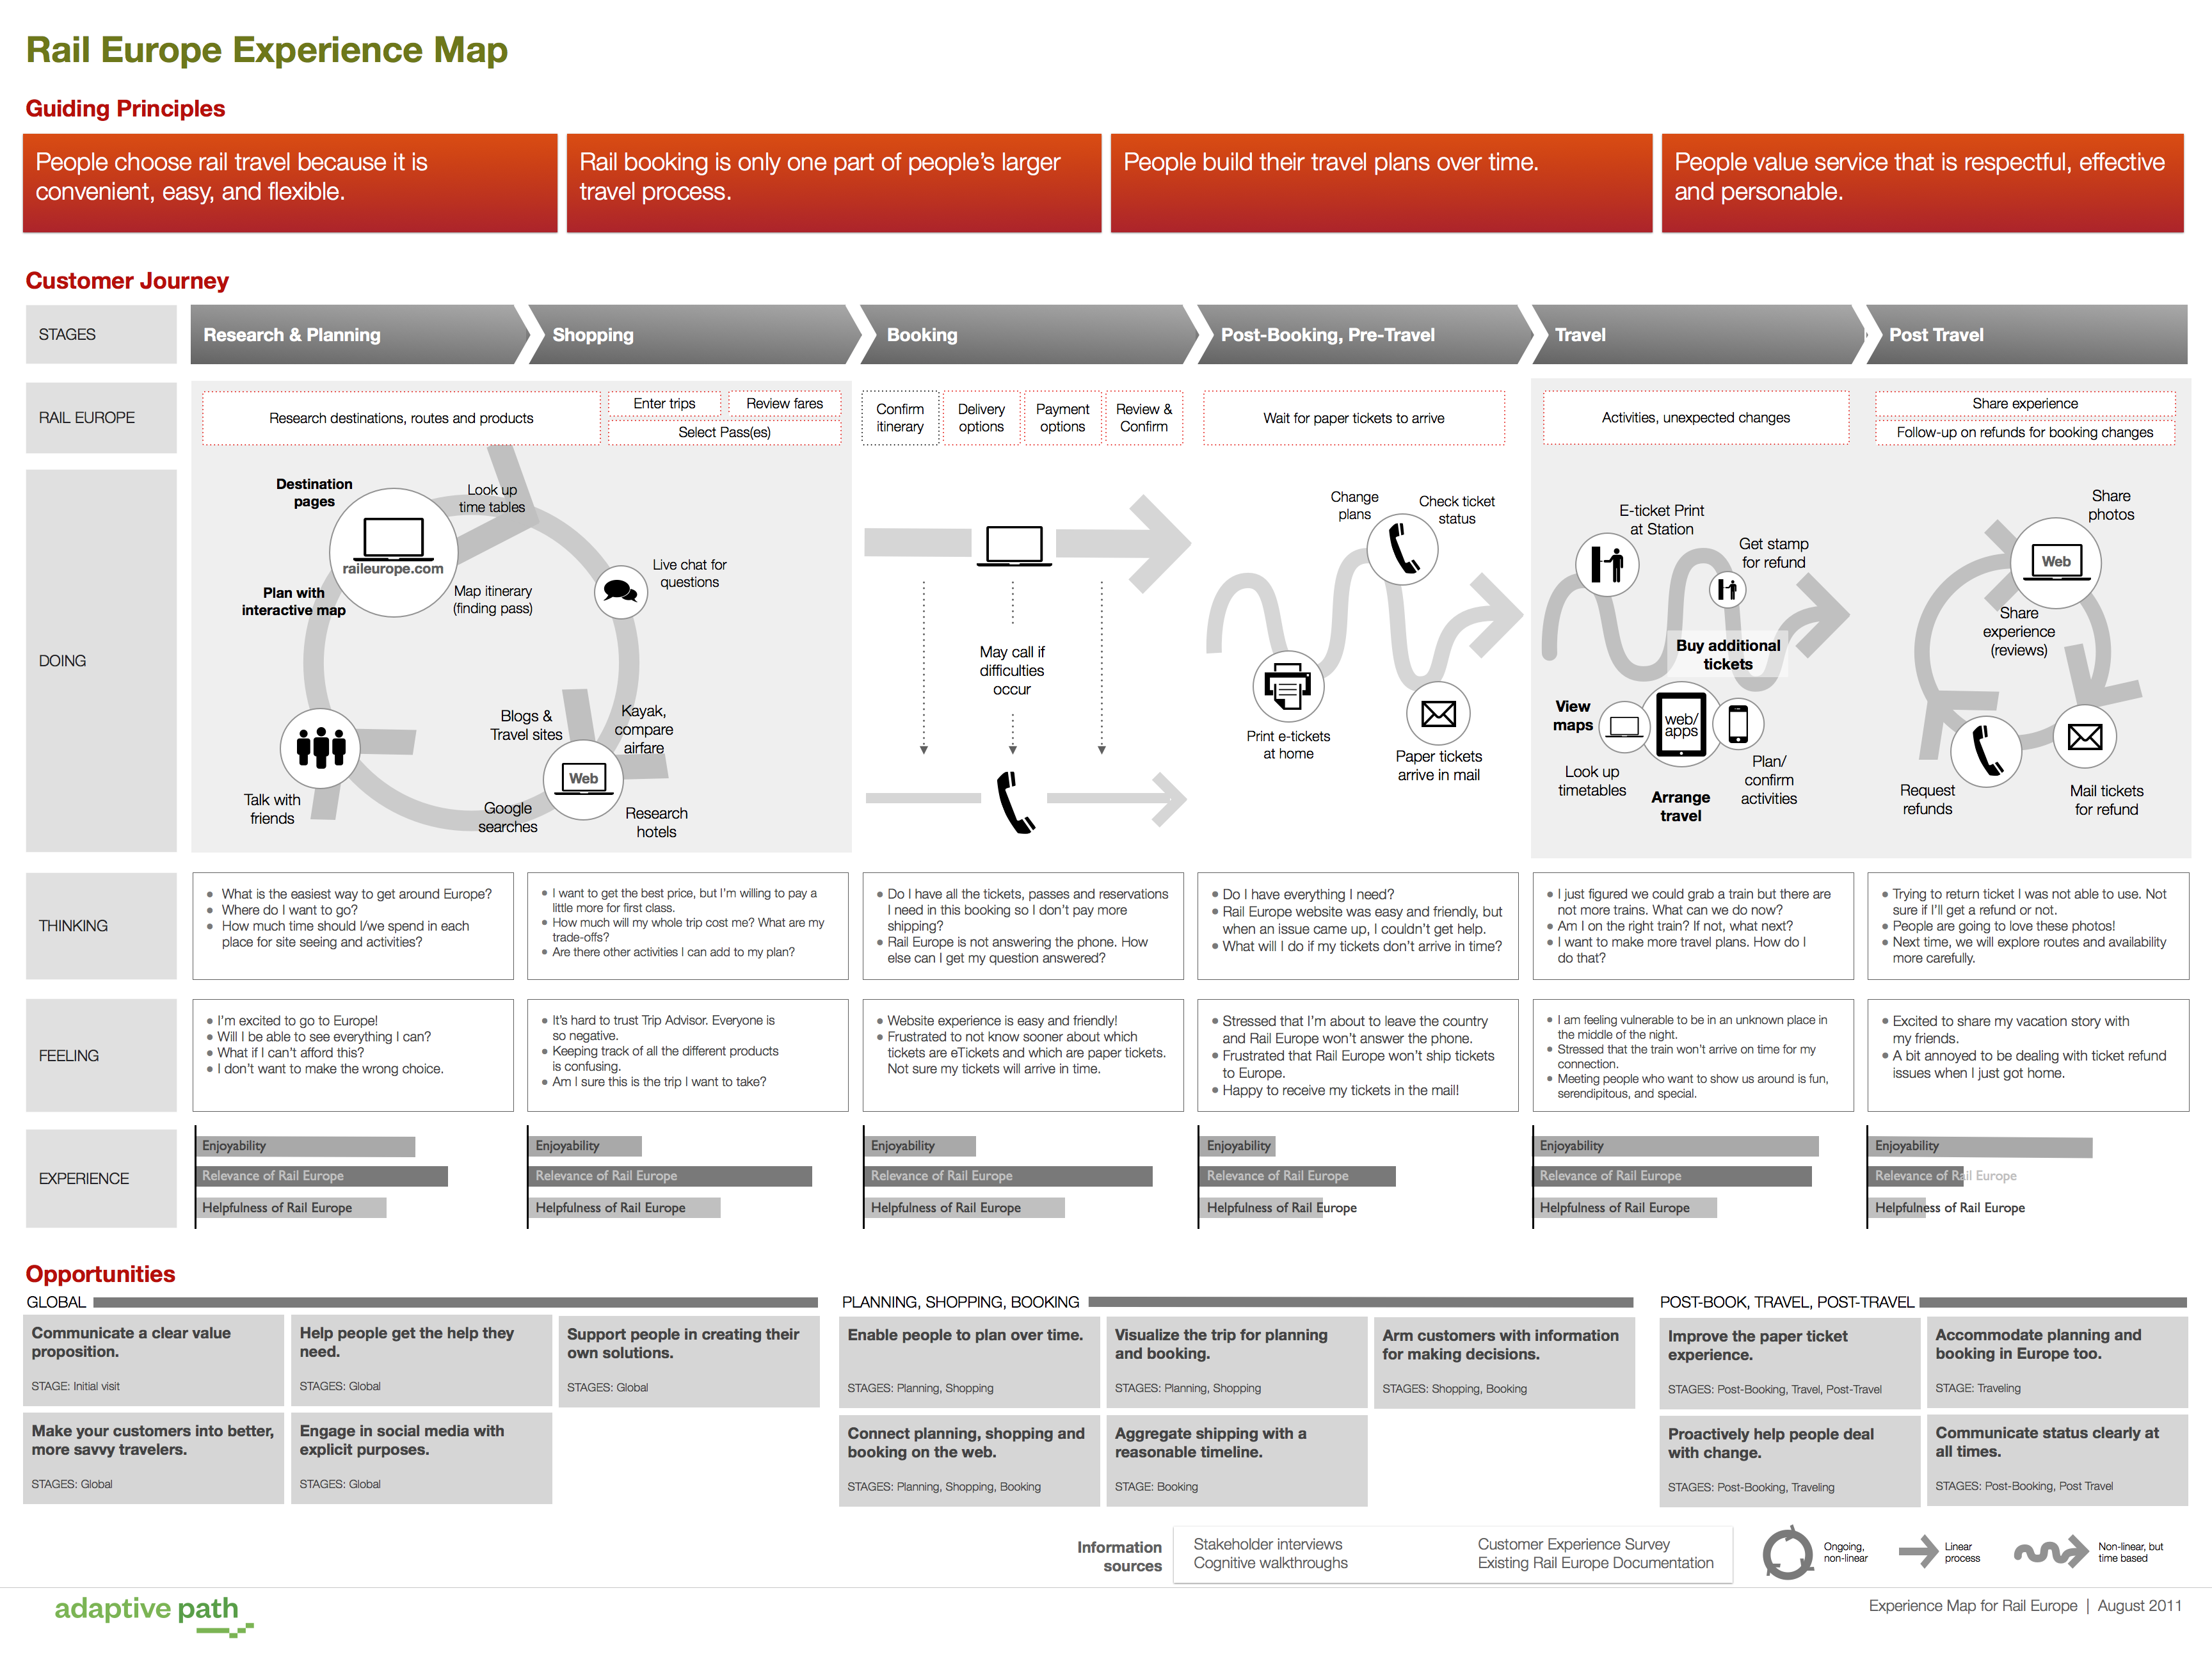
With this rising business need, one tool has become increasingly popular among marketing, product and user experience professionals: the Journey Map. Although it is used with different names by different companies (customer/user journey map, experience map, empathy or ecosystem map), it usually involves the following key elements:
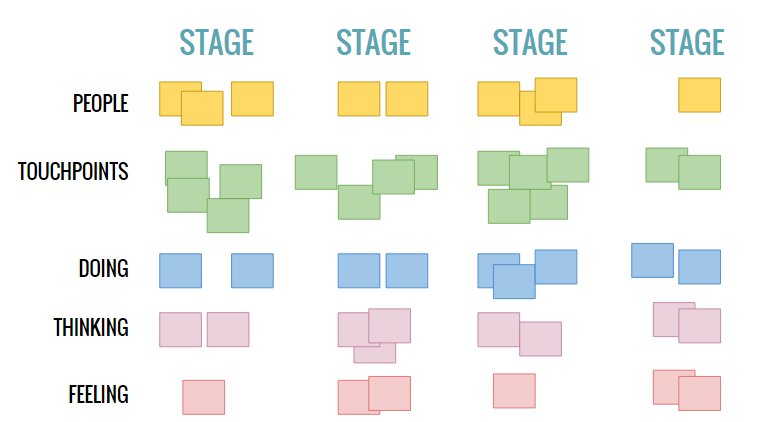
Stages: what are the steps that customers take when getting to know your brand and use your product?
And, for each stage:
People: who is involved?
Touchpoints: what are the points of interaction with the brand/product?
Doing: what are some key activities and behaviors of the customers?
Thinking: what are their expectations and goals?
Feeling: what are their perceptions and feelings?
Experience level: Is this a high/low/average point in the journey?
Adaptive Path has a series of good journey map examples, like the one for Rail Europe:
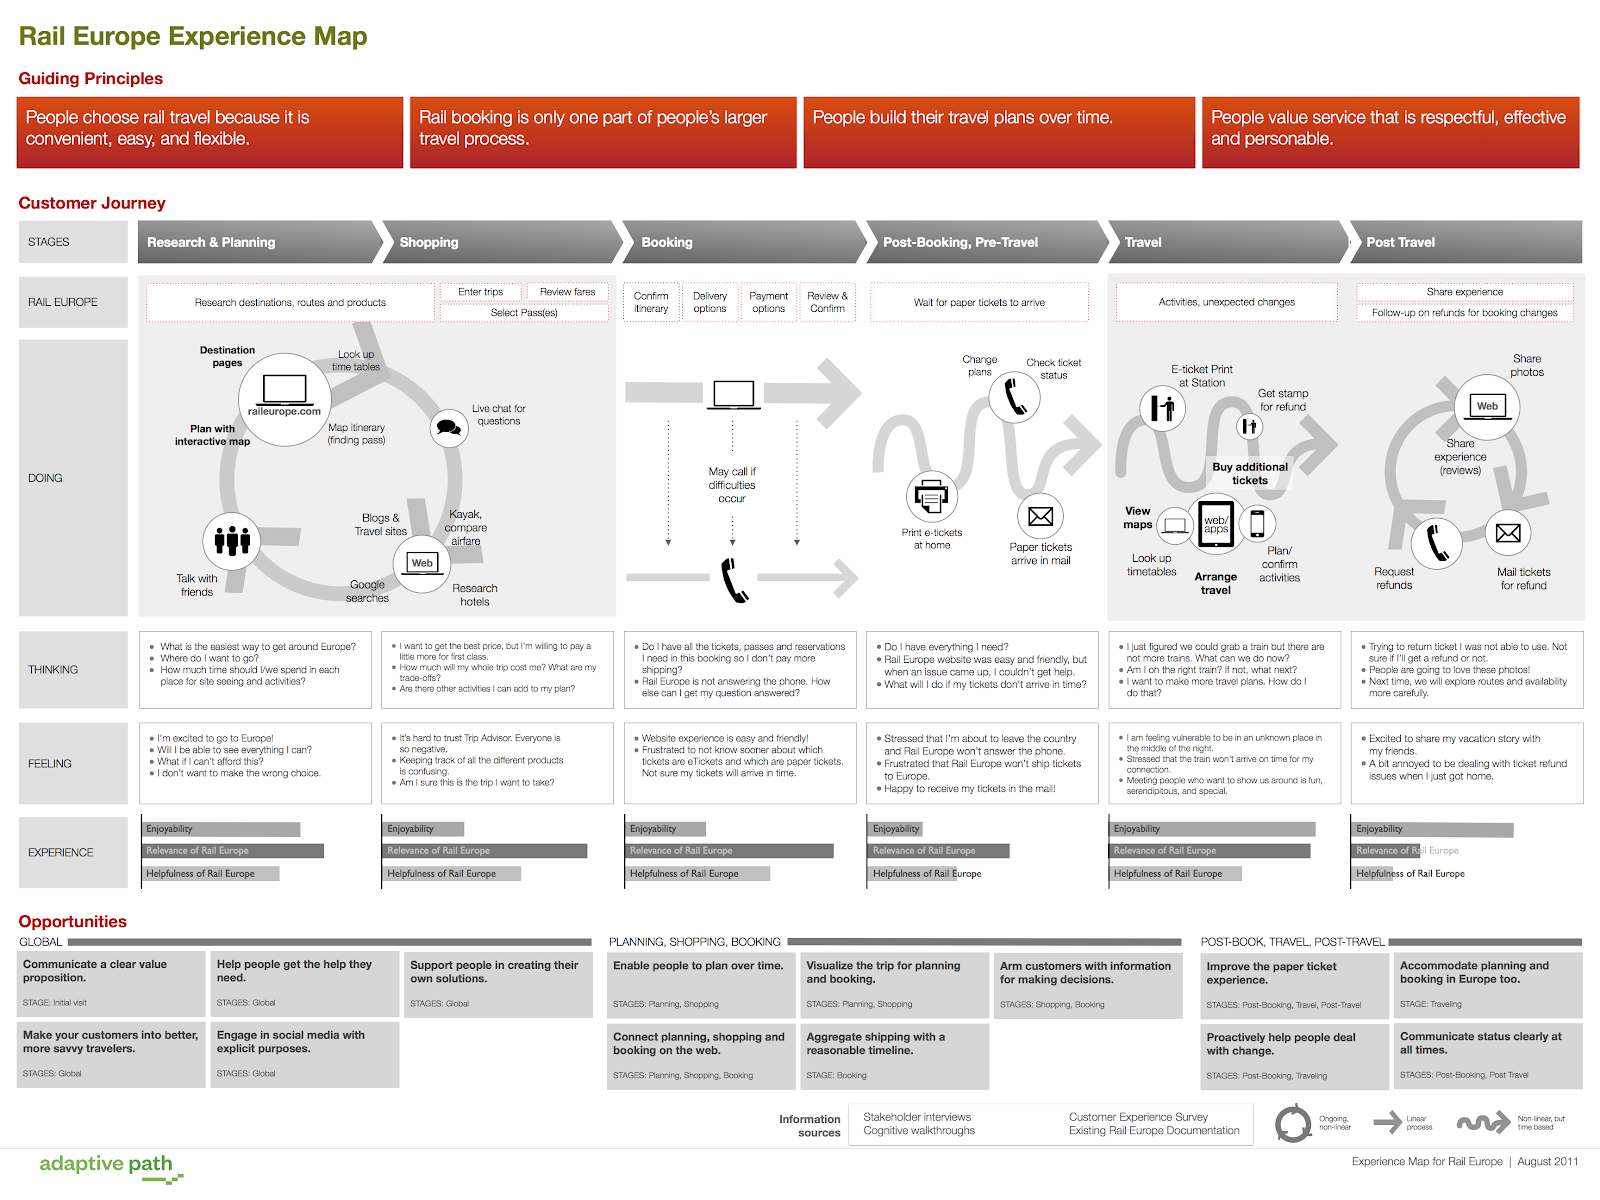
(view larger image here)
Side note: Adaptive Path also has a guide for creating experience maps here.
–
Having a valid journey map can bring valuable insights for informing both marketing actions and product development. What if we combine the Journey Map concept with Analytics?
Measurement can come in really handy minimally as a health check for critical stages in the journey map and, also, as a tool that supports experiments for improving business goals (e.g. conversions from a stage to another in the funnel) and the user experience (e.g. average time for completing an action in the journey).
Nowadays we are flooded with lots of analytics tools and there is also lots of data generated by our users. The biggest pitfall is probably to use the most popular analytics tool and to start monitoring standard KPIs.
Having a journey map, deciding on specific stages to focus on (e.g. awareness? trial?), setting objectives for those stages, setting KPIs, setting targets for each KPI, selecting data that is most relevant for tracking the KPIs, selecting the tool that offers the best (fast, easy to use) visualization of analyzed data (analytics) and then rigorously measuring the performance for each KPI, for each objective – is a better informed approach that is closer to the reality of your brand and product and that will, most likely, yield much better business results.
Enjoy creating brands and products that offer great experience levels in every stage of your customer’s journey!
This Thursday’s article provided by Bülent Duagi, IAA Young Professionals member.
(Pastila administrata de Bülent Duagi, membru IAA Young Professionals.)